Every number,
with its working shown.
Unverified sustainability claims in this industry are close to worthless, so this page publishes the arithmetic behind every figure we quote — including the ones that are awkward and the ones we cannot measure well.
Need these numbers for a report?
Ask for a diversion certificate for your own batches — that is the document your auditor actually wants.
Tell us what you have.
We will tell you what it is worth.
Buying, selling, washing, hauling or recycling — one form covers all of it. Replies come from a specialist in York, PA, by email, inside one business day.
Prefer plain email? Write to info@ibctotesreco.com — include your ZIP, quantity and what the totes last held.
We weigh everything on certified scales — once at the inbound gate and again at every outbound route — and reconcile monthly. Diversion is a weight measurement and is therefore solid. Avoided carbon is a calculation from yard-metered energy and water plus published emission factors, which makes it an estimate; we publish the inputs so you can disagree with it specifically rather than generally. Freight is excluded deliberately.
1 — Containers recovered
A unit counts as recovered when it crosses our inbound gate from a generating site or a cleanout and subsequently leaves the yard in service — sold, leased or redelivered after contract washing. Units that arrive and go straight to recycling are counted in the diversion figure but not in the recovery figure, because nothing was recovered in the sense that matters.
Current total: 418,400 since 2009, from scale tickets and sales records.
2 — Landfill diversion
Inbound weight at the gate is the denominator. The numerator is everything that leaves by a recovery route: reuse, rebottling, HDPE regrind, steel scrap, timber and composite recovery, and harvested components. What is left is manifested residue.
2025 figure: 97.4% diverted, 2.6% manifested. Reconciled monthly. This is the number we are most confident in because it is a weight, not a model.
3 — Avoided CO₂e
For each container returned to service we count the cradle-to-gate footprint of the new unit it displaced, less our own reconditioning footprint.
- 118 lb virgin HDPE at ≈ 1.8 kg CO₂e per kg of resin.
- 62 lb hot-dip galvanised steel at ≈ 2.5 kg CO₂e per kg.
- Blow-moulding and cage fabrication energy, from published process data.
- Less our reconditioning: metered gas for water heating, metered electricity for pumping and lighting, and water treatment load, divided by units processed.
That produces roughly 410 lb CO₂e for a new unit against 34 lb for a reconditioned one, and 182 lb for a rebottled one. Multiplied across recovered units the cumulative figure is 31.9M lb.
4 — Water
A wash cycle consumes roughly 90 gallons of process water, of which the settling, dissolved-air flotation and cartridge train return about two thirds to the lance. Fresh make-up water is therefore about 31 gallons per unit washed, metered at the inlet. Before the loop was built in 2019 the same cycle consumed over 90 gallons of fresh water.
What we cannot measure well
- Freight. Excluded. Lane and load factor dominate it and we would be choosing our own numbers.
- Downstream service life. We know how many lives a bottle has in theory; we do not know what our customers do with them afterwards, so we claim nothing about it.
- Capital goods. The embodied carbon of our buildings, racking and trucks is not in these figures.
- Regrind end-use. We know who takes our HDPE regrind; we do not track what it becomes, so we do not claim displacement credit for it.
| Input | Factor |
|---|---|
| Virgin HDPE resin | ≈ 1.8 kg CO₂e / kg |
| Hot-dip galvanised steel | ≈ 2.5 kg CO₂e / kg |
| HDPE regrind (processing) | ≈ 0.5 kg CO₂e / kg |
| Natural gas, water heating | Metered per cycle |
| Electricity | Renewable tariff + 48 kW array |
| Fresh water per wash | 31 gal, metered |
| Water recirculation | ≈ 66% |
| Heat recovery | 62% |
Diversion rate since we started measuring it properly
2019 is the first year with a complete reconciled record — before that the water loop did not exist and the sludge accounting was weaker.
| Year | Units in | Diversion | Manifested | Notable change |
|---|---|---|---|---|
| 2019 | 19,400 | 88.2% | 11.8% | Closed-loop water train commissioned |
| 2020 | 26,800 | 90.6% | 9.4% | Food line run six days a week |
| 2021 | 24,100 | 92.4% | 7.6% | Upcycled builds workshop opened |
| 2022 | 27,300 | 94.1% | 5.9% | Lease pool launched |
| 2023 | 29,600 | 96.1% | 3.9% | Diversion certificates formalised |
| 2024 | 31,200 | 96.8% | 3.2% | Stainless stream added |
| 2025 | 33,900 | 97.4% | 2.6% | Sludge dewatering upgraded |
Unit counts are inbound containers of all kinds, including cage-only and scrap lots. Diversion is by weight, not by unit count — which is the harder and more honest basis.
Five questions to ask any reconditioner
Including us. If the answers are vague, the numbers are decoration.
Where does your sludge go?
Every wash line produces residue. A yard that cannot tell you how it is characterised, dewatered and consigned is either not washing much or not telling you something.
Is diversion measured by weight or by unit count?
Unit count flatters. A hundred containers diverted and one tonne of sludge manifested looks like 99% by count and much worse by weight. Weight is the honest basis.
What is the denominator?
Inbound gate weight, or only the material that made it to a decision point? Excluding the awkward fraction from the denominator is the oldest trick in waste reporting.
Is the carbon figure verified, or calculated?
Ours is calculated, from our meters and published factors, and we say so. A number presented as verified should come with the name of whoever verified it.
Can you certificate my specific batch?
Yard-wide totals belong to the yard. For your own reporting you need a document that names your containers, their weights, their routes and their dates.
Ledger FAQ
Who audits these numbers?
The weights are from certified scales — one at our inbound gate and reconciled against outbound tickets from each material stream — and they are reconciled monthly in our own books. The carbon figures are our own calculation from yard-measured energy and water combined with published emission factors, not a third-party verified footprint. We say so plainly rather than implying external assurance we do not have.
Why is the diversion rate 97.4% and not 100%?
Because residue sludge exists. Heels, settled solids and flotation skimmings are dewatered, characterised and consigned under manifest to a licensed facility. That stream is about 2.6% of inbound weight and it cannot be diverted — a yard claiming 100% is either not counting it or not telling you about it.
How do you calculate avoided CO₂e?
For every container we return to service, we count the cradle-to-gate emissions of the equivalent new unit it displaced, minus the emissions of our own reconditioning. The new-unit figure is built from 118 lb of HDPE at roughly 1.8 kg CO₂e/kg and 62 lb of hot-dip galvanised steel at roughly 2.5 kg CO₂e/kg, plus moulding and fabrication energy. Our reconditioning figure comes from metered gas, electricity and water per wash cycle.
What do you deliberately exclude?
Freight. It varies more by lane and load factor than by anything we control, and including it would let us flatter ourselves by quoting full-truckload numbers. We also exclude the embodied carbon of our buildings and equipment, and we do not claim credit for emissions avoided downstream by our customers.
Can I use these figures in my own reporting?
Use the per-unit figures with attribution and the caveats above, and ask us for a diversion certificate for your own batches — that document is specific to your containers and is the right basis for your reporting. Our yard-wide totals are ours, not yours.
Every figure on this page is reconciled monthly and republished when it changes. If you think one of them is wrong, write to info@ibctotesreco.com with your reasoning and we will either correct it or explain why we disagree — in writing, as with everything else here.
Related pages
Every dataset behind every claim
If a figure appears anywhere on this site, its working is in one of the tables below.
| Year | Units in | Diversion | Manifested | Notable change |
|---|---|---|---|---|
| 2019 | 19,400 | 88.2% | 11.8% | Closed-loop water train commissioned |
| 2020 | 26,800 | 90.6% | 9.4% | Food line run six days a week |
| 2021 | 24,100 | 92.4% | 7.6% | Upcycled builds workshop opened |
| 2022 | 27,300 | 94.1% | 5.9% | Lease pool launched |
| 2023 | 29,600 | 96.1% | 3.9% | Diversion certificates formalised |
| 2024 | 31,200 | 96.8% | 3.2% | Stainless stream added |
| 2025 | 33,900 | 97.4% | 2.6% | Sludge dewatering upgraded |
| Route | CO₂e | Fresh water | Virgin resin | Virgin steel |
|---|---|---|---|---|
| New unit | ≈ 410 lb | ≈ 290 gal | 118 lb | 62 lb |
| Rebottled | ≈ 182 lb | ≈ 120 gal | 47 lb | 0 lb |
| Reconditioned | ≈ 34 lb | ≈ 31 gal | 0 lb | 0 lb |
| Repurposed Grade C | ≈ 11 lb | ≈ 14 gal | 0 lb | 0 lb |
| Input | Quantity | Factor or source |
|---|---|---|
| Virgin HDPE resin | 118 lb / 53.5 kg | 1.8 kg CO₂e/kg |
| Blow moulding energy | 53.5 kg part | 0.4 kg CO₂e/kg |
| Hot-dip galvanised steel | 106 lb / 48 kg | 2.5 kg CO₂e/kg |
| Cage fabrication & assembly | 48 kg | 0.3 kg CO₂e/kg |
| Mechanical HDPE recycling | per kg processed | 0.5 kg CO₂e/kg |
| Fresh water per wash | 31 gal / unit | Metered |
| Natural gas, water heating | per programme | Metered per bay per shift |
| Electricity | per unit | Renewable tariff + 48 kW array |
| New valve, gaskets, lid | ≈ 3 lb | ≈ 8 lb CO₂e |
The operational facts that produce them
Diversion improves when you separate decisions, not when you change reporting.
Wash programmes — where the energy and water go
| Code | Programme | Temperature | Chemistry | Cycle | Relative cost | Suits |
|---|---|---|---|---|---|---|
| P1 | Ambient flood rinse | Ambient | Process water, occasional mild alkaline | 90 sec | 1.0× | Water-miscible residues |
| P2 | Hot detergent | 140°F | Alkaline detergent 1.5–2.5% | 3 min | 2.2× | Oils, fats, filming products |
| P3 | Caustic clean-in-place | 160–180°F | NaOH 2–4% + surfactant | 6–9 min | 4.5× | Pigments, latex, resins, heavy concentrates |
| PF | Food line (Bay 1) | 140°F | Alkaline detergent 2% + 100% hydrostatic | 3 min + test | 3.1× | Documented edible prior service |
| Refused | Not accepted | — | — | — | — | Unknown, acute, labelled-destruction, radiological |
Failure modes — what sends a unit down each route
| Mode | Cause | What it looks like | Recoverable? | Prevention | Frequency |
|---|---|---|---|---|---|
| UV embrittlement | Unshaded outdoor storage | Chalky, boardy, higher-pitched tap | No | Cover or shade it | Most common |
| Stress whitening at the radius | Over-fill, freeze, uneven ground | White crackled lower corners | No | Level pad, respect max gross mass | Common |
| Plasticisation & ghosting | Pigment, resin, solvent absorption | Permanent shadow when backlit | Rebottle | Match chemistry to material | Common |
| Freeze damage | Left full and sealed | Bulged panel, split seam, blown boss | Sometimes fittings only | Drain or 2/3 fill, vented lid | Seasonal spike |
| Valve boss cracking | Unsupported pump or rigid pipe | Star crazing at the boss root | No — rebottle | Support the pump separately | Avoidable |
| Impact puncture | Forklift tine, drop, collision | Hole or deep gouge | No | Handling discipline | Rare |
| Cage racking | Soft ground, foot impact, over-fill | Diagonals differ by > 1/2" | Jig if under 1/2" | Level load-bearing pad | Common |
| Weld node cracking | Fatigue, previous field weld | Rust bloom then crack | No | Never field-weld a cage | Occasional |
| Pallet rot / delamination | Timber base outdoors | Soft bearers, split deck | Replace base | Specify steel or composite | Very common |
| Seal failure | Compression set, wrong elastomer, reuse | Weeping at the boss or lid | Yes — new seal | Replace at every product change | 71% of reports |
Service life by exposure — the cheapest intervention available
| Exposure | Realistic life | Note |
|---|---|---|
| Indoors, dry, no direct sun | 10–15 years | The bottle outlives most process changes |
| Indoors, skylights / direct sun | 8–12 years | Rotate the containers occasionally |
| Outdoors, fully covered | 9–14 years | A cover is the highest-return intervention there is |
| Outdoors, shaded north side | 7–10 years | Orientation matters as much as cover |
| Outdoors, partial sun | 5–7 years | One face chalks before the other |
| Outdoors, full sun | 3–5 years | Chalky, boardy wall; sudden failures |
| Outdoors, full sun + freeze cycles | 2–4 years | The worst combination we see |
Pallet bases — repairability across more than one cycle
| Factor | Steel | Composite | Timber |
|---|---|---|---|
| Typical weight | ≈ 44 lb | ≈ 31 lb | ≈ 38 lb |
| Outdoor life | Indefinite with zinc repair | Good, UV-dependent | 2–4 winters |
| Forklift tolerance | Excellent | Fair — decks crack | Fair — bearers split |
| Pallet-jack entry | Four-way, usually | Four-way, check depth | Often two-way only |
| Repairable | Yes — welded, re-zinced | No | Partly |
| Washability | Good | Excellent | Poor |
| Pest / splinter risk | None | None | Real |
| ISPM-15 on export | Not applicable | Not applicable | Required |
| Hygiene-sensitive use | Acceptable | Preferred | Avoid |
| Cost new | Highest | Middle | Lowest |
| Replacement rate at our bench | Low | Low–moderate | Highest by far |
| Our default on rebottled units | Yes | On request | No |
Grade matrix — including the Loop Score
| Grade A | Grade B | Grade C | Cage / pallet only | |
|---|---|---|---|---|
| Bottle clarity | Clear / near-clear | Haze & staining permitted | Ghosting permitted | n/a |
| Prior service | Documented edible, signed at source | Industrial, declared | Industrial, declared | Any declared |
| Wash programme | Food line, recorded | Programme to residue, recorded | Ambient rinse | Cage rinse only |
| Hydrostatic test | 100% of units | Sampled | Sampled | n/a |
| New valve & gaskets | Yes, FDA-compliant | Yes | Sound or new | n/a |
| New lid | Yes | Yes | Sound or new | n/a |
| Re-marked | Yes | Yes | Where the plate survives | No |
| Stackable when filled | 2 high | 2 high | No | n/a |
| 30-day leak warranty | Yes | Yes | No — watertight at loading | No warranty |
| Food / potable | Yes, with records | No | No | n/a |
| Cost vs new | ≈ 35–45% | ≈ 25–32% | ≈ 18–24% | ≈ 5–10% |
| Lead time | Ex-stock to 5 days | Ex-stock | Ex-stock | Ex-stock |
| Loop score (lives left) | 5–6 | 4–5 | 2–3 | 3–4 bottles |
Documents that evidence it per batch
| Document | What it contains | When you get it |
|---|---|---|
| Written quotation | Unit price by grade, freight as its own line, validity, and the conditions that would change it | Before you order |
| Grade certificate | Assigned grade against our published definitions, per unit serial | With the order |
| Leak & pressure test record | Test pressure, hold time, outcome, per serial | With the order |
| Hydrostatic test certificate | 100% of food-line units, recorded against serial | Food-grade orders |
| Prior-contents declaration | Named last product, generating site, signature | Anything we collected |
| Wash programme record | Bay, programme, temperature, chemistry, cycle time | Reconditioned & contract work |
| Rinse verification | Final-rinse pH and conductivity | Reconditioned & contract work |
| Component specification | Valve, gasket, lid materials with compliance references | Food-grade orders |
| Photograph set | The actual units on the rack before loading | Every order |
| Weight ticket | Certified-scale gross weight and count | Collections and cleanouts |
| Diversion certificate | Unit counts, weights by stream, destination routes, dates | End-of-life batches |
| Certificate of insurance | GL, auto, cargo, workers' comp; additional insured | Before a crew arrives |
| Reconditioner marking detail | Code, date, design type | Re-marked units |
| Lease schedule | Count, grade, dates, weekly rate, return condition, replacement charge | Leases |
Regulations governing waste determination and discharge
| Reference | Title | What it covers | Who it binds |
|---|---|---|---|
| 49 CFR 172.101 | Hazardous materials table | Classification and authorised packaging reference | Shippers |
| 49 CFR 172 Subpart H | Training | Who must be trained, in what, how often, with records | Any hazmat employer |
| 49 CFR 173 | Shippers — general requirements by class | Whether an IBC is authorised for your entry | Shippers |
| 49 CFR 178 Subpart N | IBC design types, testing and marking | What the plate means and how it was earned | Makers, reconditioners |
| 49 CFR 180.352 | Periodic inspection, testing, repair & remanufacture | 2.5-year visual, 5-year leakproofness + full inspection | Owners, shippers |
| 40 CFR 261.7 | RCRA empty containers | When a container counts as empty; P-list triple rinse | Generators |
| 40 CFR 262 | Generator standards | Waste determination, manifesting, accumulation | Generators |
| 21 CFR 177.1520 | Olefin polymers | HDPE compliance for food contact | Food users |
| 21 CFR 177.2600 | Rubber articles for repeated use | Gasket and seal compliance for food contact | Food users |
| 21 CFR 110 / 117 | Good manufacturing practice | Handling, storage, sanitation programmes | Food users |
| NSF/ANSI 61 | Drinking water system components | Potable-contact material evaluation | Water utilities |
| 29 CFR 1910.1200 | Hazard communication | Workplace labelling and safety data sheets | Everyone |
| 29 CFR 1910.146 | Permit-required confined spaces | Entry into tanks and vessels | Anyone cleaning containers |
| 29 CFR 1910.178 | Powered industrial trucks | Forklift operation and certification | Yards and docks |
| ANSI/ITSDF B56.1 | Low-lift and high-lift trucks | Capacity ratings and load centres | Yards and docks |
| ANSI MH16.1 | Steel storage racking | Beam capacity, deflection, inspection | Warehouses |
| PA Title 25 Ch. 95 | Wastewater treatment requirements | Industrial discharge standards in Pennsylvania | Wash lines |
| ISPM-15 | Wood packaging in international trade | Heat treatment and marking of timber pallets | Exporters |
Sixteen datasets, each published in full
Everything this site measures, with the row count and the page it lives on. None of it is behind a form.
What 97.4% looks like
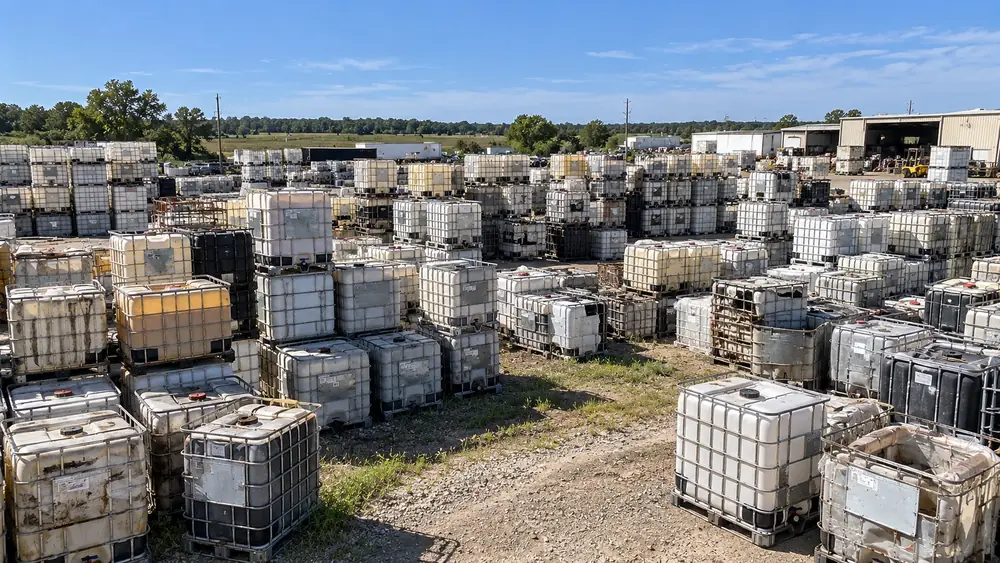
Every container in this photograph crossed a certified scale on the way in, and every one of them will cross one again on the way out — as a container, as regrind, as steel, as timber, or as the 2.6% that leaves under manifest.
That is the whole method. The diversion figure is a weight measurement rather than a model, which is why we are confident in it in a way we are deliberately not confident about the carbon numbers beside it.